
What an ERMI Test Measures
The ERMI gives you a relative reading of what is detected in your home relative to a set of samples collected in other homes. It can’t tell you if there is or is not mold growth in your home. It can only tell you how the dust compares to dust collected from other housing units. We don’t know if these other units had mold or not.
Why (Some) Doctors Recommend the ERMI Test
Doctors like the ERMI because they say traditional air samples do not detect mold. This assertion is taken out of context. They are referring to when a homeowner asks a mold inspector to do a mold test. The air samples collected are called spore traps which consist of sticky glass slides onto which airborne particles stick. Spore traps have become the normal way of collecting air samples as they are easy to collect and have a fast turnaround time. Doctors are correct in saying that a single spore trap may not detect mold growth in a home.
Prior to the mid 2000s, we collected several types of air samples. This was and is still the best way of using air samples to test for mold. We collected spore traps, as well as second and third sets of cultured air samples. Doing so tripled the cost and took ten days to receive the results. As more home inspectors became “mold inspectors,” they kept things simple and price competitive. They were trained to collect spore traps. Many inspectors do not know how to culture air samples. An Anderson sampler is required to collect cultured air samples. It’s a device you won’t find a mold inspector’s tool box.
Just as a doctor must choose a type of media to culture a swab taken from a nose or throat, so must a mold inspector choose which types of agar to use to collect an air samples for culture. Not all molds like the same type of food. To get accurate results, you could use two or three types of agar. The complexity and cost of this sampling strategy is why the EPA attempted to invent an alternative method such as the ERMI. Nice research project; It didn’t work as well as they thought it would.
What to Consider
It is prudent to test your home for mold. If you have mold, whether that’s the source of mycotoxins in your body or not, it’s helpful to have a home that supports your heath. If you test your home (using conventional tests) and don’t find mold, you can relax and rest assured the work you do with your doctor to get healthy isn’t inhibited by living in a moldy environment. An ERMI test is not the best way to test your home for mold.
Before you jump to testing, do a visible inspection. Look for water damage and things that look as if they did or could have gotten. If you have not done an ERMI test, don’t do one. There are better ways to test your home for mold. If you’ve done an ERMI, read on to learn more and how to interpret the results and how to do it better.
—————————————-
The Environmental Relative Mold Index (ERMI)
The ERMI was created by the EPA in the early 2000s to give homeowners a simple, affordable mold test. Dust samples from 1,131 HUD, low-income housing units were used to create the baseline.
To use the ERMI, a homeowner collects a sample of dust from their home using a dust swifter or vacuum. The laboratory tests the dust sample for spores and fragments of molds using a type of DNA test. The results are compared to the baseline of 1,131 housing units.
I discovered the EPA scientists who worked on developing the ERMI receive a percentage of royalties paid to the EPA from laboratories that analyze the samples. I noticed this while reading the paper “Development of an Environmental Relative Moldiness Index for US Homes,” in the fine print under the abstract.
The EPA’s office at that time was located in Cincinnati. Under heavy marketing from laboratories, homeowners, mold remediators, and home inspectors started using the ERMI. Then doctors jumped on the bandwagon.
The EPA realized it needed to expand the number of cites to outside of Ohio. In 2006, working with the Department of Housing and Urbanite Development (HUD), they expanded the number of cities from which dust samples were collected for the baseline. The collection of the additional samples for the ERMI study was piggy-backed on a national survey to study levels of lead-based paint in homes as part of the HUD’s American Healthy Home Survey. The cities have not been disclosed.
The homes tested were those in a program the government provides assistance to landlords on behalf of low-income tenants. A housing unit was defined as a house, apartment, mobile home, group of homes, or single room occupied as a separate living quarters. Of those selected to participate, only 1,131 tenants completed the survey. If you use the ERMI, your results are compared against those 1,131 units.
The ERMI cannot detect DNA inside a spore. Mold spores have thick outer shells made of chitin, one of the hardest known substances. The laboratory must break the spores open. They do this by grinding the dust sample with a metal roller as used by a baker to roll dough.
Much of the processes, equipment, and chemicals used by laboratories to analyze ERMI samples have not been validated or disclosed. I didn’t realize, for example, that ERMI results could be skewed by chemicals present in house dust until a client sent me an ERMI report in which the laboratory hand wrote on the page for the test results: “Results are skewed due to chemical found in dust sample -- chemical interferes w/ test results. (Our lab) can’t say whether the mold results should be higher or lower than what’s reported... just that the #’s are skewed.”
After the ERMI was introduced, mold remediators started using it to convince homeowners remediation was necessary. After spending tens of thousands of dollars but failing to achieve the low ERMI scores they desired, people complained to the Office of the Inspector General (OIG). In 2013, the OIG required the EPA to release a statement reminding people that the ERMI is a research project and not intended for professional use. They substantiated allegations that many of the homes tested did not need mold remediation.
Understanding the ERMI Research Study Data
DID YOU KNOW? CE/mg = Cell Equivalents per milligram of dust. It refers to the estimated number of mold cells in a sample, based on the amount of DNA detected. It's not counting cells (spores), rather inferring cell presence from genetic material.
The following pages contains an excerpt from the study published by the EPA scientists as the ERMI was developed. Data from the initial study is provided for those curious about “numbers” and why the “ERMI score” can be misleading.
Notice which molds were found in most of the housing “units” tested, the average level that was detected in an average home, and so forth.
A few odd and ironic observations about the data that do not make sense in regard to how the ERMI study was used to calculate ERMI scores:
The mean (average) level of Stachybotrys detected was very low - 2.
The mean level of Chaetomium detected was very low - 2.
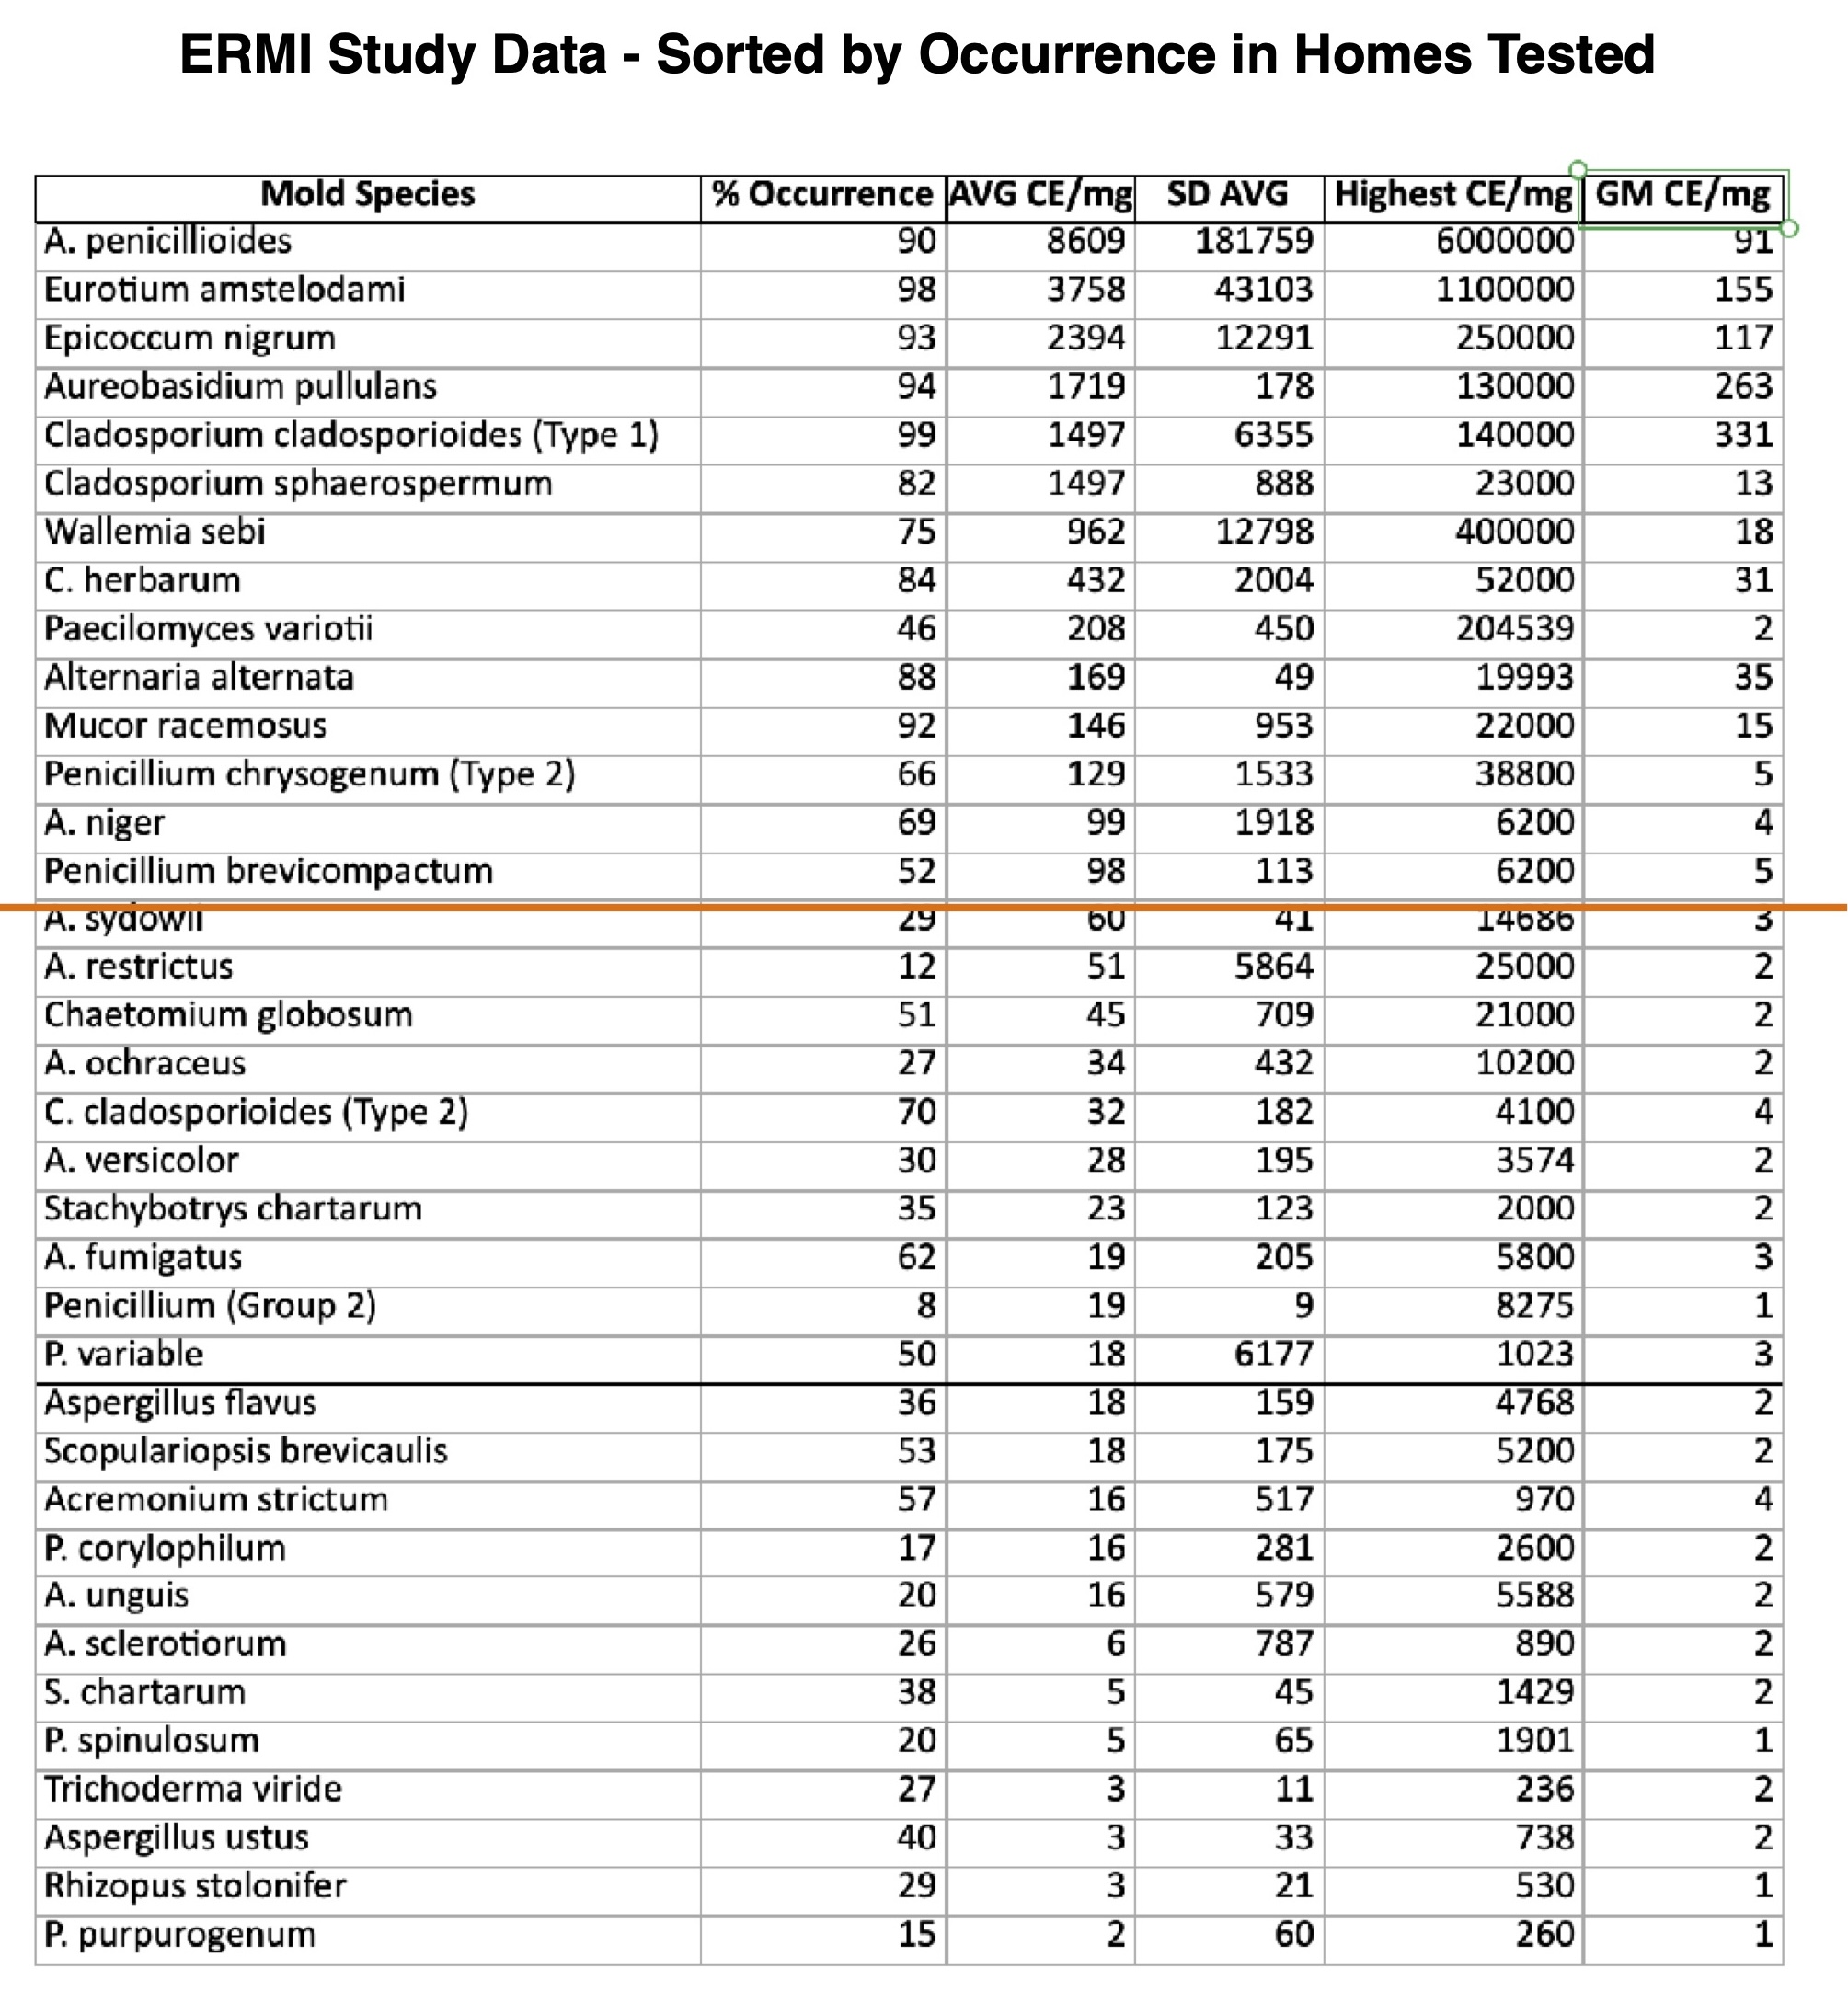
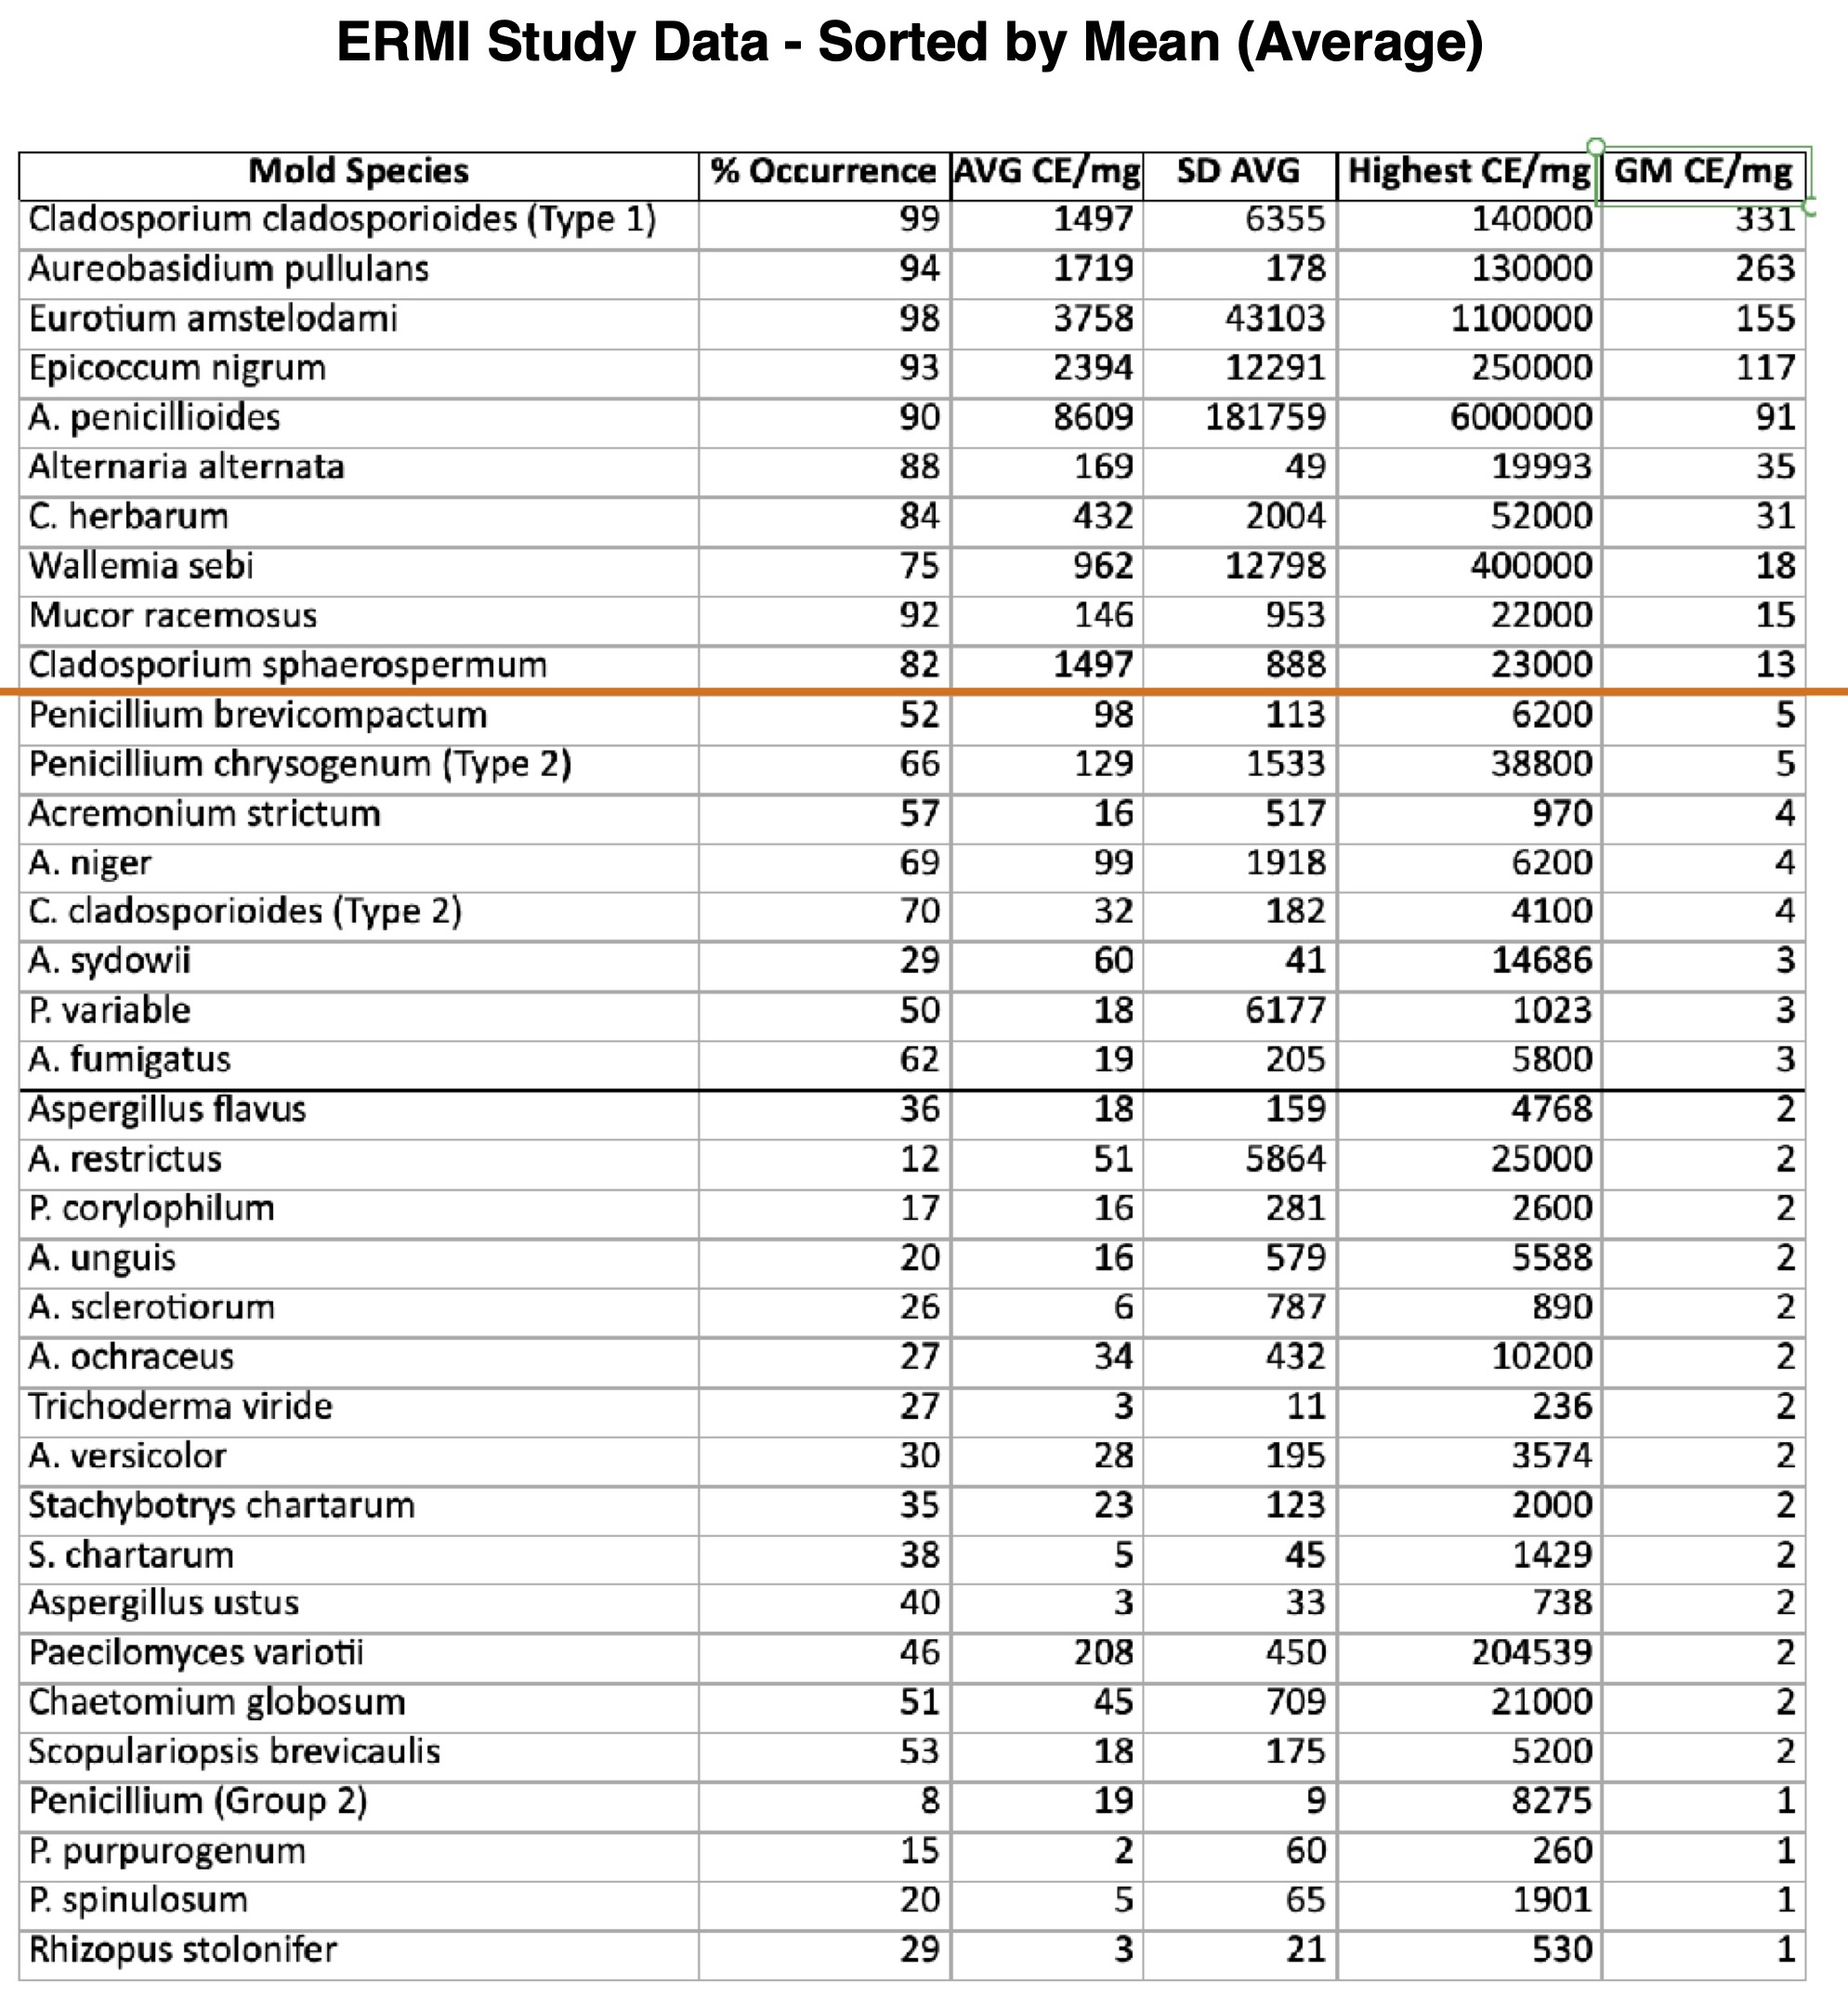
If you sort the data by species averages (GM), it most pof the molds detected were at low levels. That’s because most molds detected in any indoor sample come from outside - not inside a home.
The Myth of High Mold = High Risk: GM and SD Don’t Tell the Whole Story
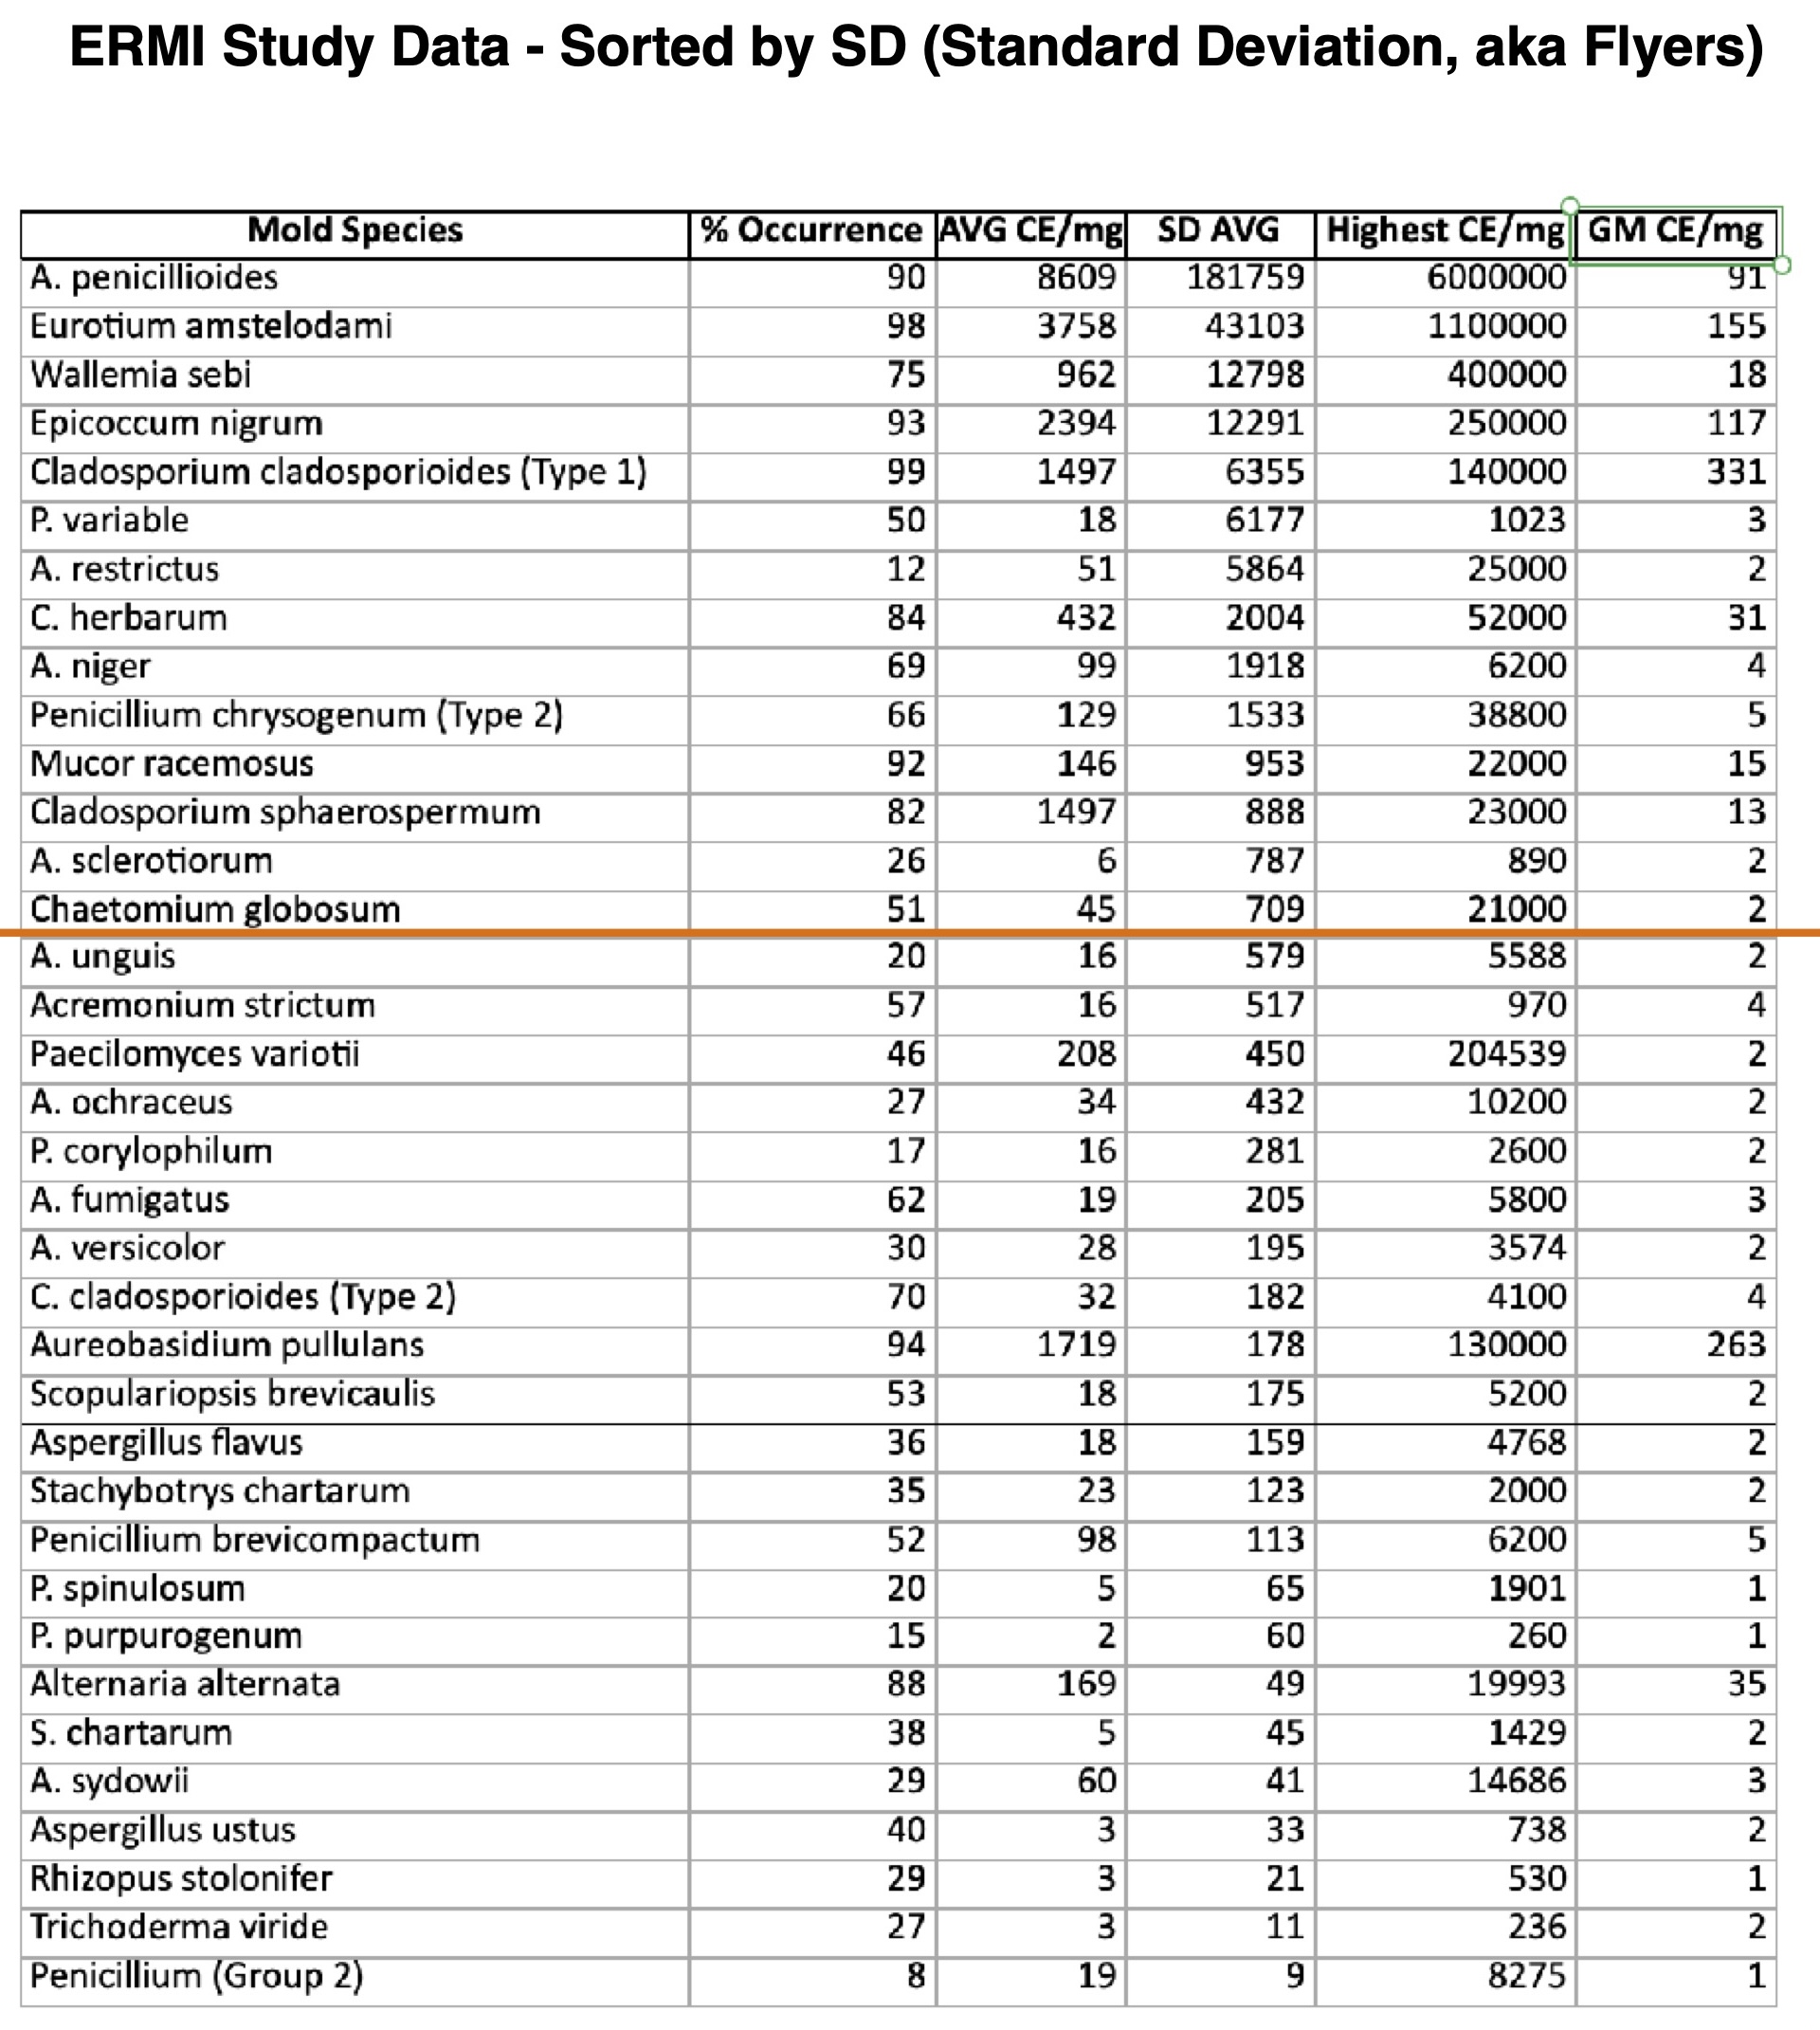
SD (Standard Deviation of the Average Concentration) - How spread out the mold concentration values are across different homes. A high SD means that some homes had much higher (or lower) levels than others. It's a warning that the average might not tell the full story. Example: A. penicillioides has an average of 8,609 CE/mg and a staggering SD of 181,759. This tells you there are huge outliers—possibly homes with massive contaminations of this mold.
GM (Geometric Mean) - the “typical” value. The GM gives a representative average for comparing species. Example: Aureobasidium pullulans had an AVG CE/mg = 1,719 and GM CE/mg = 263. This shows the average is pulled up by very high values in a few homes, while the GM suggests most homes had levels around 263 CE/mg.
- GM = what’s “normal.” Use GM to understand typical mold levels across the homes tested for the study.
- SD = spots outliers to assess variability—how extreme the spikes were.
- A high GM and high SD means a species was widespread and high.
- A low GM and high SD means the mold was typically low; high in rare cases.
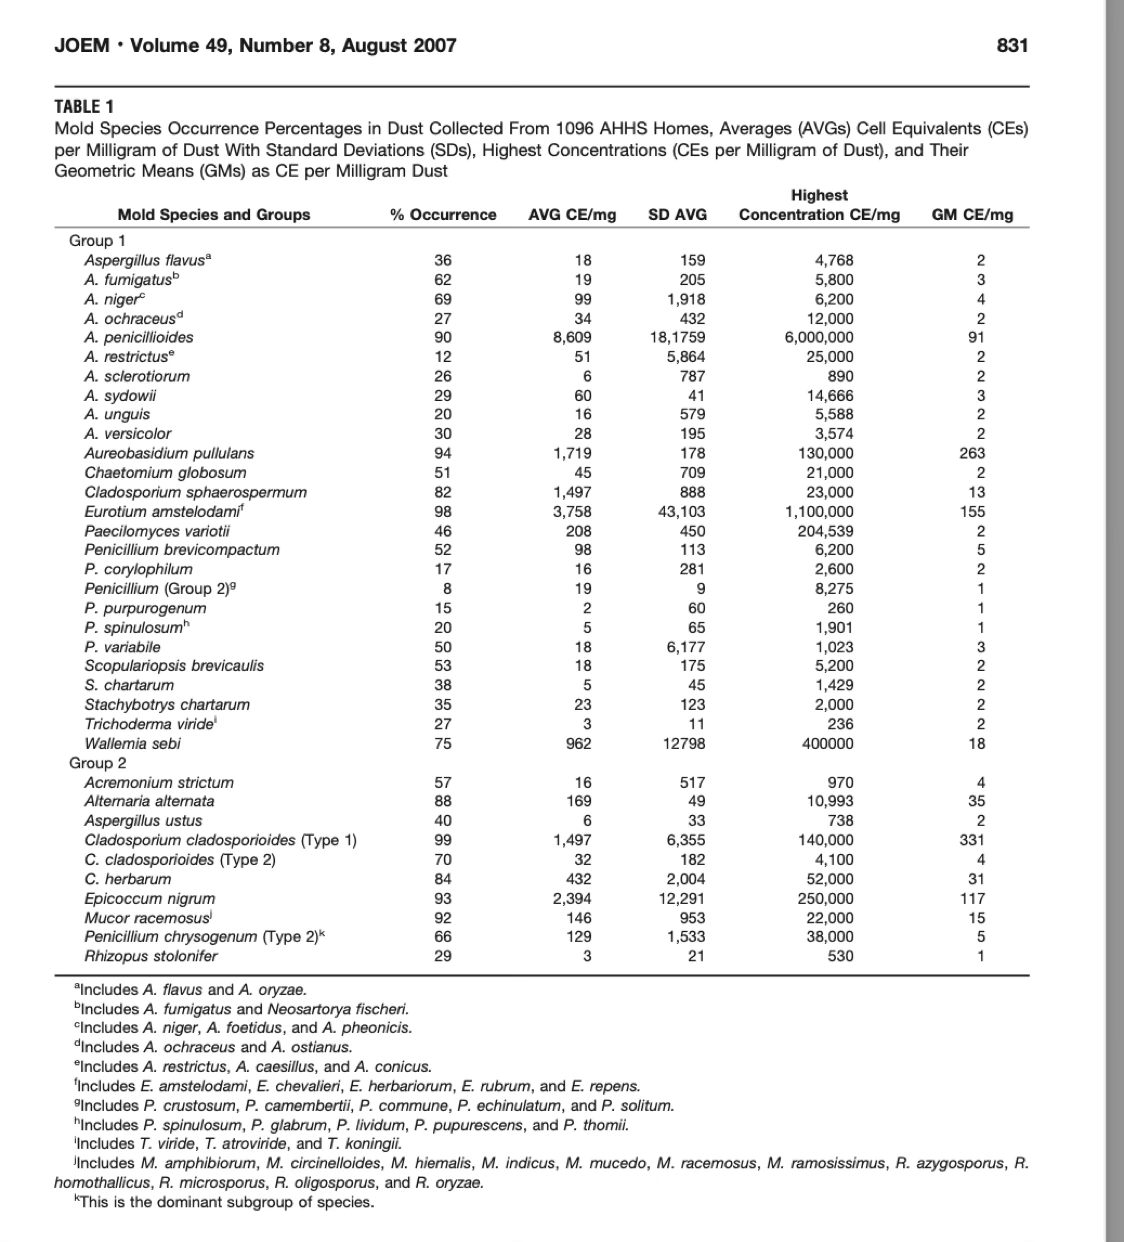
Excerpt from the study the ERMI is based on, showing the percentage of housing units in which mold was detected and how much. Notice how often Stachybotrys was detected and the levels. This is not intended to be used to interpret the results of an ERMI test, rather to demonstrate the mere detection of a type of mold does not mean you have mold growing in your home.The Myth of High Mold = High Risk: GM and SD Don’t Tell the Whole Story
Misleading ERMI Score Interpretation
The Real Meaning of High GM and High SD
MYTH: “A high GM and high SD means it’s a serious mold we should worry about.”
This is overly simplistic and misleading because a high GM just means the species is often present, possibly due to being ubiquitous in outdoor environments. High SD reflects variability, not risk. That variability can be due to:
- Seasonal (Cladosporium in fall)
- Geographic (humid vs dry climate)
- Sampling error (uneven dust collection, different surfaces)
More Accurate Interpretation:
High GM and high SD might indicate an outdoor or common mold that sometimes spikes indoors. These spikes do not always signal active growth. Thy could result from air movement, poor filtration, or variability in sampling and timing. Example: Cladosporium cladosporioides. GM: 331, SD: 6,355. Often cited as “widespread”. Found outdoors on plants; indoors on HVAC filters, walls, and in dust; not always a health threat. High SD could reflect outdoor air intrusion, not mold growth.
Takeaway:
A mold species with a high geometric mean and high variability (standard deviation) is often widespread. That does not mean it’s harmful. These values may reflect environmental background levels, outdoor sources, and seasonal variations. Without confirming mold growth or moisture problems, numbers alone don’t tell us if a home is unhealthy.
Notice: The post is designed for educational purposes only. Our goal is to provide information and scientific data as to the potential hazards in the home or office. All the factors to be considered are beyond the scope of this post. We do not assume responsibility for choices or decisions made including those regarding mitigation. To apply this to your specific situation, please book a 1-Hour Consultation.
HERTSMI-2
What is it?
HERTSMI-2 is an acronym for Health Effects Roster of Type-Specific Formers of Mycotoxins and Inflammagens – 2nd Version. HERTSMI-2 is an ERMI style mold test (it uses the same DNA type process to “test” dust samples); it analyses the dust samples for 5 molds. The idea was to improve on how an “ERMI” test might be improved to generate better and more accurate conclusions as to whether there are “toxic” molds in your home making you sick. These molds are called the “Big 5”.
How HERTSMI-2 Differs from ERMI
HERTSMI-2 looks at 5 mold species; the original ERMI looks at 36 mold species. The species included in a HERTSMI-2 are:
- Aspergillus penicillioides
- Aspergillus Versicolor
- Chaetomium Globosum
- Stachybotrys Chartarum
- Wallemia Sebi
Problems with HERTSMI-2
1. Wallemia Sebi
As show in a real world case study, Wallemia Sebi is an outdoor molds (all molds are sourced from outdoors). In my experience, clients who think they have mold indoors based that on the detection of Wallemia Sebi. Those who also collected an outside ERMI were able to see their home is not contaminated; those who do not panic and think they have mold. In my opinion the ERMI scientists are to blame. They are the ones who originally placed this species in a category of concern. Subsequent parties should consider eliminating this species from their list.
2. Aspergillus penicillioides
As show in a previous data table, Aspergillus penicillioides is one of the most frequently detected mold species in indoor environmental samples, particularly dust samples and in the highest amounts.A. penicillioides is xerophilic (loves dry environments). It can grow at very low water activity (0.60–0.65 aw), where most molds cannot survive. It’s common in dry dust, low-humidity homes, and archived materials. This explains why it shows up in nearly every ERMI sample and in the highest amounts. It shows up in homes that appear "clean" or have no visible mold. It's ubiquitous. Its presence in large amounts does not automatically mean a home is unhealthy or water-damaged.
In the ERMI study date, A. penicillioides has the highest Geometric Mean (GM) of all species. It also has a low-to-moderate SD, meaning it’s consistently present across many samples. Because of this, it heavily influences the ERMI score. ERMI overstates concern when this species is elevated, given its common presence in "normal" homes. Aspergillus penicillioides is a dust-loving survivor mold, not a water-damage signal. Its high detection rate in ERMI and other sampling methods reflects its ecology, not necessarily a problem with the home.
3. Aspergillus Versicolor
Aspergillus versicolor is significant in the context of indoor environmental quality and health. Unlike Aspergillus penicillioides, A. versicolor is less common and more concerning.
Looking at the previous data tables, Aspergillus versicolor was not found in every home. It appeared in approximately 30% of homes with a moderate to high standard deviation (SD). This suggests that while it's uncommon in many homes, its concentration can be high in some — possibly those with mold growth. Therefore, we might consider this species when interpreting results, particularly when levels are elevated relative to other species. It’s not that easy. The following is an example where Aspergillus versicolor was detected (42 CE/mg), Chaetomium was not detected, and Stachybotrys was detected at a low level (10 CE/mg). There was in fact no mold in this house, as verified by extensive testing and a more complete and extensive investigation.
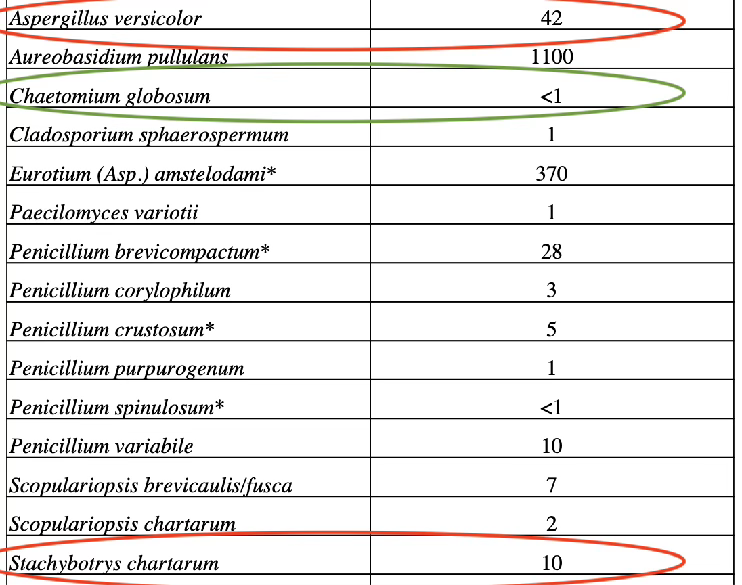
The average level of Aspergillus versicolor detected in the ERMI study was 28 CE/mg. If we were to use 28 CE/mg as a threshold of concern, we would have incorrectly concluded there was a mold problem in this home, especially when you consider Stachybotrys was detected.
We would have also been in error if our decision tree had flagged Aspergillus versicolor as a concern when it’s the dominant mold in the result, or significant because it was seen along with Stachybotrys.
While Aspergillus versicolor is associated with mold indoors and capable of growing indoors, it is ubiquitous in the environment and not specific to water-damaged conditions the way Stachybotrys and Chaetomium are.
There’s another reason the ERMI and HERTSMI-2 may unknowingly be giving Aspergillus versicolor too much weight of importance. The spores of species of Aspergillus are changed together like a pearl necklace. If these spores do not break apart, rather a fragment settles in the dust with part of a chain intact - the test will consider each one of the spores as a separate entity. You maybe mislead to think you have 10 or 100 instead of a single organism present.
—> This leaves us with only two species to consider when interpreting an ERMI or HERTSMI: Chaetomium and Stachybotrys.
The HERTSMI‑2 Scoring System
Dr. Ritchie Shoemaker developed a scoring system to interpret results from a HERTSMI‑2 test. Using data from a real world home, I calculated a score for it. Based on the mold levels in this home and the HERTSMI-2 scoring system (referenced on the website for the organization, Surviving Mold) the total score for this sample is: HERTSMI-2 Score: 18. This scoring system considers this to be dangerous, especially for individuals with mold sensitivity or Chronic Inflammatory Response Syndrome (CIRS).
Table : Calculating a HERTSMI-2 for the Above Test Data using the Guidelines on the website for Surviving Mold
| Mold | Result | Points |
| Aspergillus penicillioides | 150 | 6 |
| Aspergillus versicolor | 42 | 4 |
| Chaetomium globosum | 0 | 0 |
| Stachybotrys chartarum | 10 | 4 |
| Wallemia sebi | 130 | 4 |
*Score Interpretation on the Surviving Mold website:
- Score ≤10: Safe for hypersensitive individuals.
- Score 11–15: Borderline; proceed with caution.
- Score ≥16: Dangerous for those with CIRS. Do not enter.
The HERTSMI-2 score for this example is18 - Dangerous. A further investigation in the case revealed there was no actual mold growth in the home. This is a case study for which using the ERMI or HERTSMI scoring systems lead a home owner to panic and believe they have mold when they do not. This example reinforces the concern that scores such as these over-rely on certain widespread species, and highlights the need for contextual interpretation, ones not based on numbers and scores.
Recommendations and Conclusions
I appreciate what Dr. Shoemaker was trying to do. I read he used 700 ERMI results to develop the HERTSMI. Like myself, he may have realized too much of the molds in the ERMI are ubiquitous and “normal” to be of use for identifying homes that are unhealthy. He narrowed down the list of species to test for. Good thinking.
I don’t think he considered the ultimate flaw that continues to plague such tests. The logic seems to be” “This is a group of sick people, and this is what’s in the dust in their homes. Therefore, if the dust in your home looks like this, the dust in your home is what is making you sick”. Or equally misleading - is not what’s making you sick.
The data is likely from patients he is treating. This is not too different from a normal ERMI in that we don’t know which homes have mold. The homes have not been tested and investigated using other methods. We don’t know which of those sick with symptoms thought to be due to mold exposure might be due to causes not related to mold. We don’t know which patients might be sick from a mold exposure at work or school, not mold in their homes. We don’t know which might be sick from exposure to mold in food they ate.
Doctors and organizations seem to be stuck on refining how they interpret the results of an ERMI or HERTSMI based on a database of test results. I encourage professionals to supplement their research with testing done with wall-checks and cultured (Anderson sampler) air sampling and a more rigorous visual inspection by mold inspectors who use a microscope. Mold is microscopic. Doing so will lead to a better understanding of how the HERTSMI and ERMI might be used to predict the presences of actual mold growth in a home, as they can correlate test results to homes verified to have and not have actual mold growth in them.
If we only consider Stachybotrys and Chaetomium:
Here’s my idea for a two-species HERTSMI-2 subtotal, using only Chaetomium globosum and Stachybotrys chartarum and the Surviving Mold scoring system:
Table: Calculating a HERTSMI-2 Score Considering Only Chaetomium and Stachybotrys
| Species | Result | Points |
| Chaetomium globosum | 0 | 0 |
| Stachybotrys chartarum | 10 | 4 |
This gives a HERTSMI-2 score of 4, which agrees with the findings of my further investigation and testing for the home, the results of which concluded there is no mold in the home. Recall, a score ≤10 is considered by the HERTSMI scoring system as,“Safe for hypersensitive individuals.”
There’s one last thing to consider. I’ve bee suggesting the only useful and meaningful types of mold to consider (when trying to make sense of a mold test such as this) are Chaetomium and Stachybotrys. These are genres; not species of mold. If you look, you’ll notice the ERMI (and HERTSMI) do not test for genres or classes of mold, rather specific species, in this case Chaetomium globosum and Stachybotrys chartarum.
When you have water damage and mold in a home, you may have additional species of Chaetomium and Stachybotrys, ones the ERMI and HERTSMI-2 do not test for. The reason is cost - this is an expensive DNA type of test to perform. In an effort to get the cost down, a select list of species was chosen for inclusion. The species used by the ERMI (and HERTSMI) do not include all of the possible species of mold that can grow in a home with water damage. If, on the other hand, you were to do cultured air sampling to test for mold, the lab could identify the species or at a minimum let you know they are not Chaetomium globosum or Stachybotrys chartarum.
Before You Act on Your ERMI Results
Understanding how ERMI works is one thing. Making a decision that could affect your home — and potentially thousands of dollars in remediation — is another.
If you’re about to act on your test results, it’s worth slowing down and walking through a structured evaluation specific to your home.
I’ve created the ERMI Interpretation Framework. It includes:
• A step-by-step ERMI decision flowchart
• A practical threshold reference guide
• Real-world case examples
• An overreaction filter to prevent unnecessary remediation
• A clear “what to do next” action matrix
When clients book a 1-hour consultation, I provide this framework in advance and we apply it directly to their results together. If you’d like personalized help interpreting your ERMI or HERTSMI report, and a clear action plan tailored to your situation –